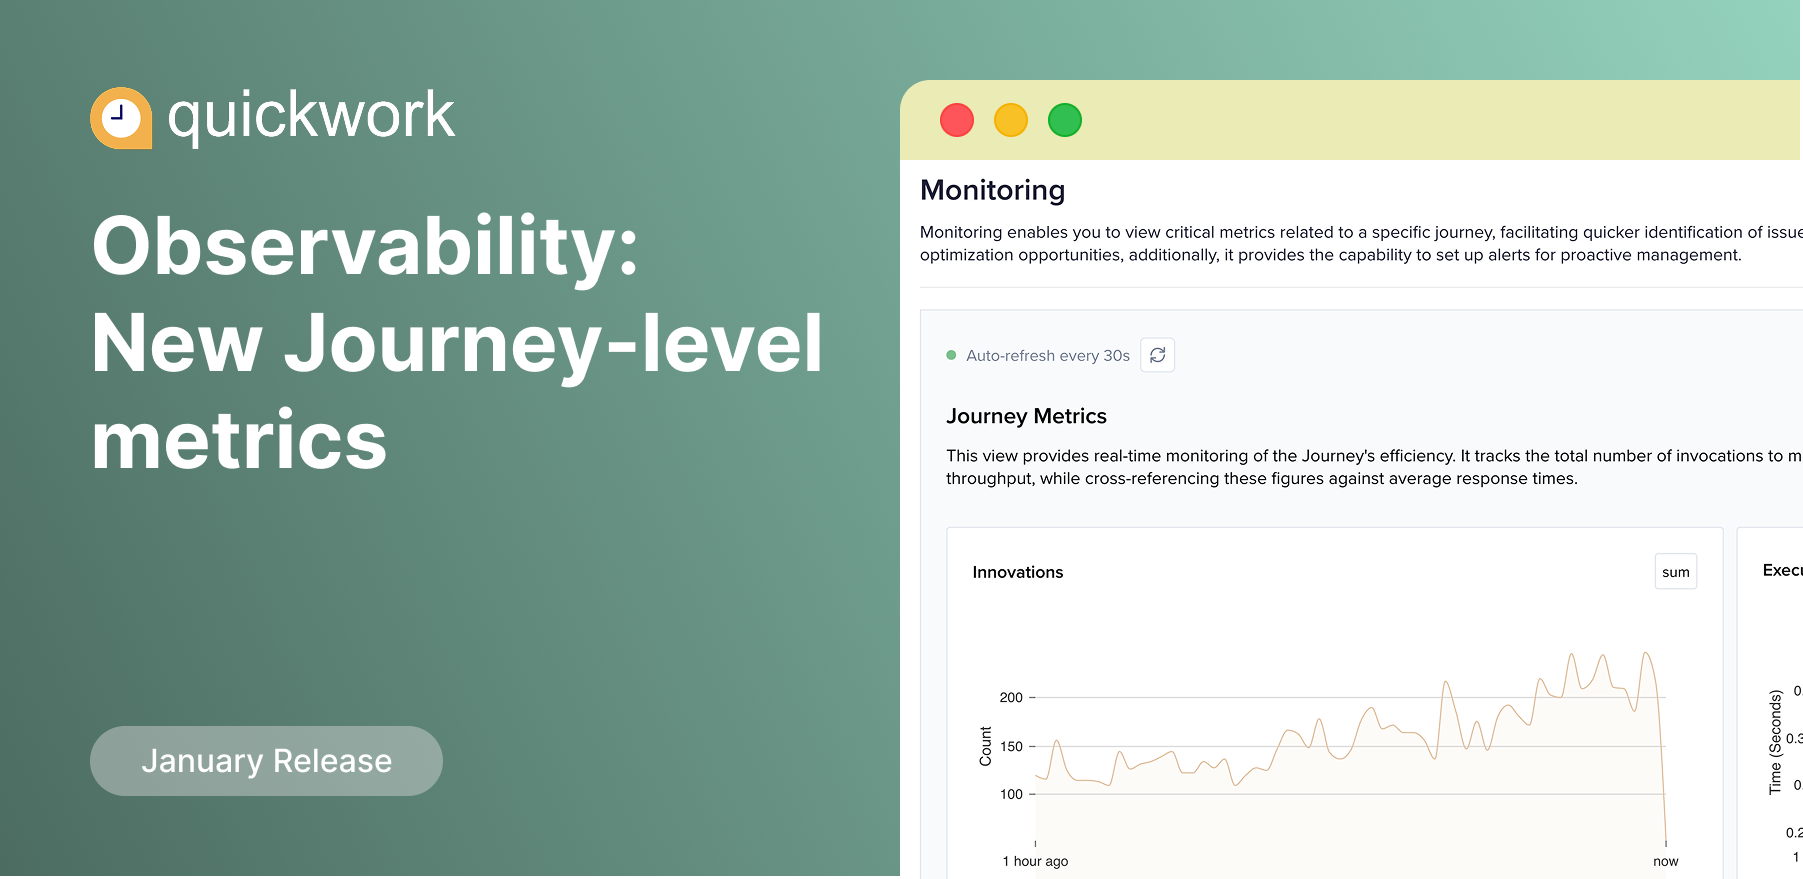
Observability: Status indicators in Journey history
by Krish Advani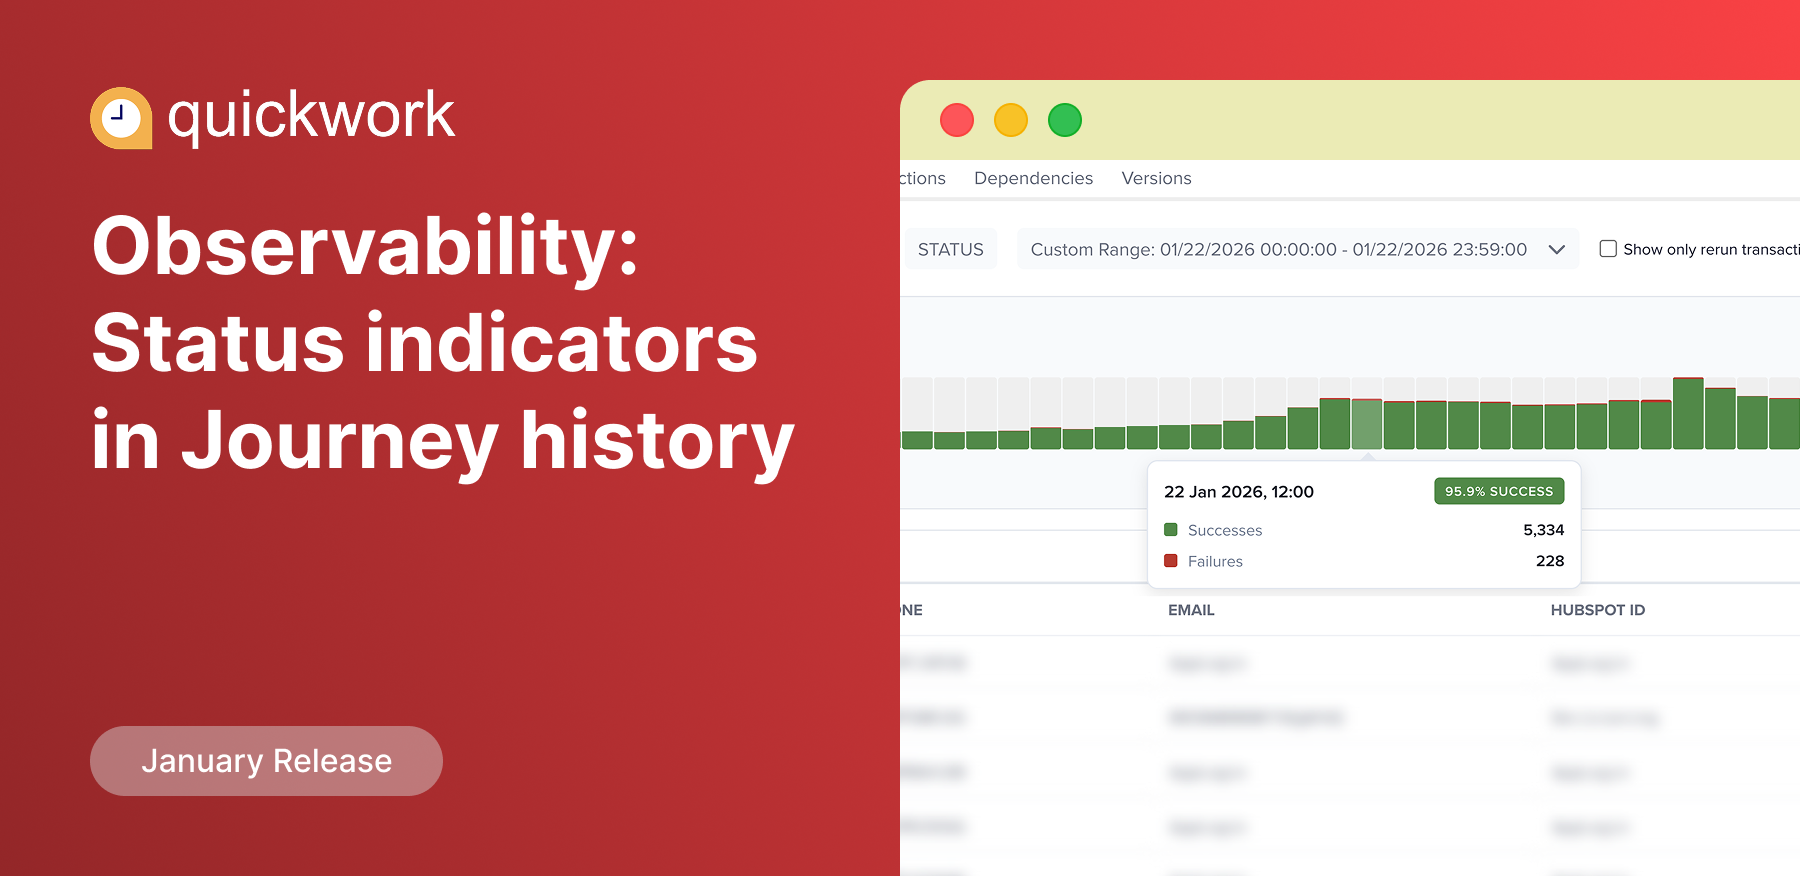
View transaction status at a glance on each Journey’s history page. See successes and failures along with the success ratio for the selected time bucket. Time range and status filters work together with the inline graph for easier analysis.