Dependency graph
The Dependency Graph page lets you visualize how a selected Quickwork resource, such as a Journey, database, or connection, interacts and depends on other assets within your workspace.
The Dependency Graph provides a visual representation of the input and output relationships between various Quickwork resources, helping you understand how assets within the system are connected and interdependent. This feature is particularly useful for analyzing the flow of data and identifying the dependencies between Journeys, connections, constants, database tables, APIs, and other resources.
✅ Prerequisites
- Basic understanding of Quickwork terminologies and familiarity with Quickwork's GUI.
- Understanding the basic principles of automation, including triggers, actions, and the concept of automated Journeys.
Accessing the Dependency Graph
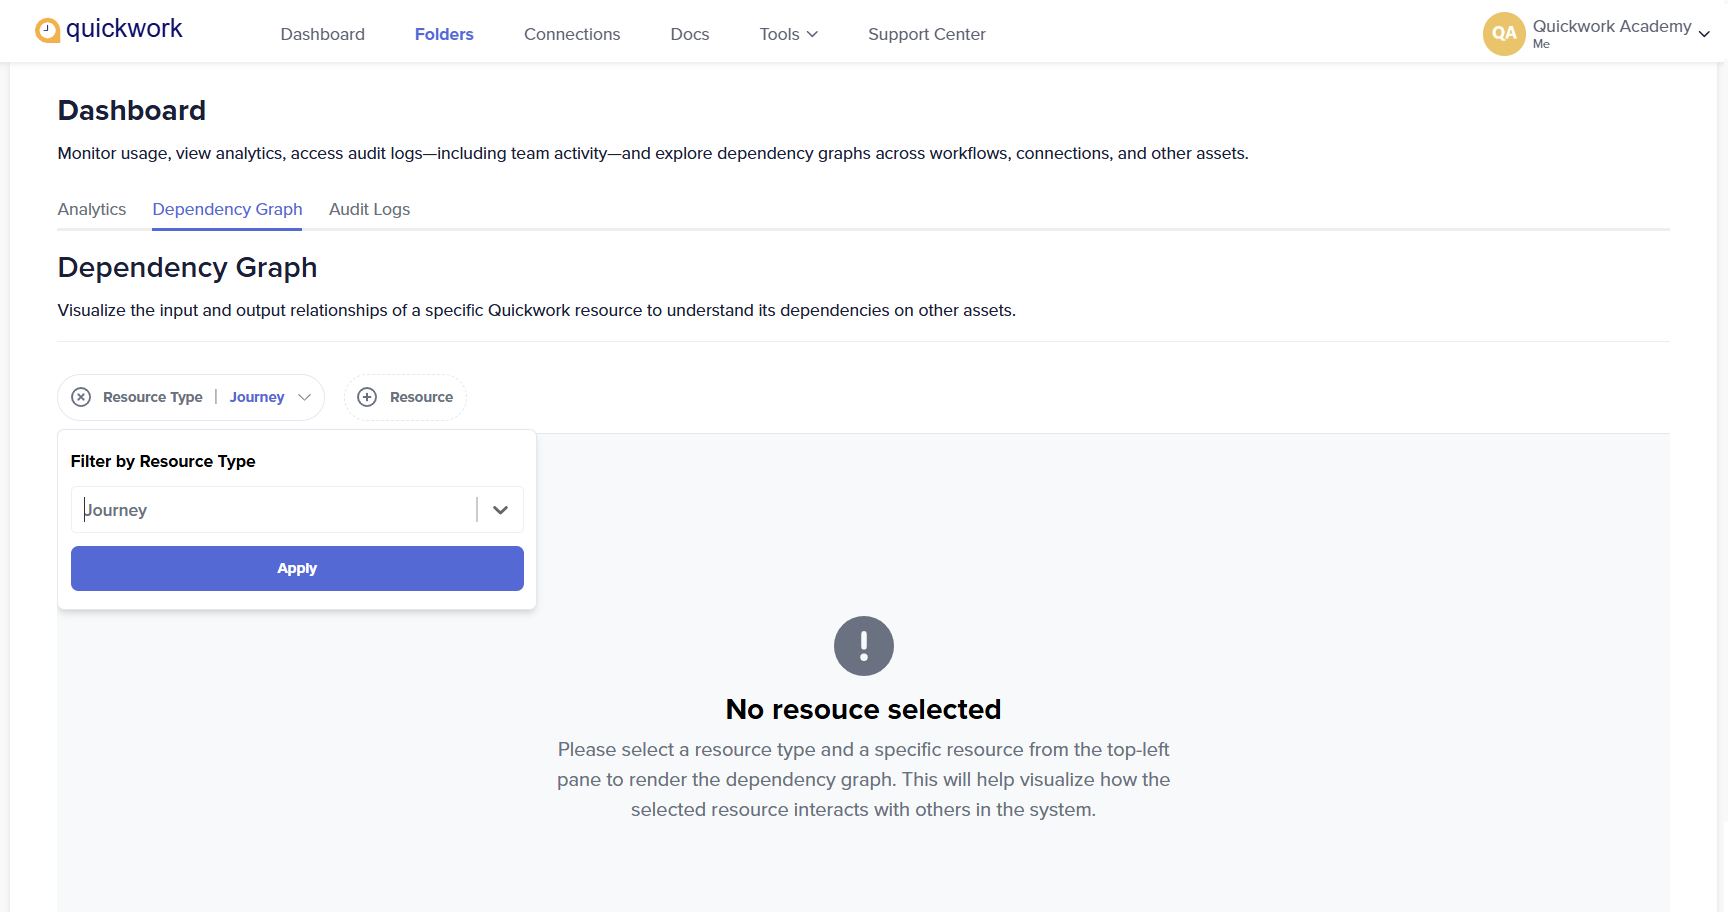
- Navigate to Dashboard - Dependency Graph.
- The page displays options to select the Resource Type and a specific Resource whose dependencies you want to visualize.
- Filter by resource type: From the Resource Type drop-down, you can select one of the following:
- Journey: Displays dependencies related to a specific Journey and its connected assets.
- Constants: Shows constants linked to a Journey or Callable Journey.
- Database Table: Visualizes dependencies between database collections and Journeys.
- Content Template: Displays which templates are used across Journeys.
- API Route/API Collection: Reveals how APIs and routes interact with other components.
- Connection: Highlights relationships between specific app connections and Journeys.
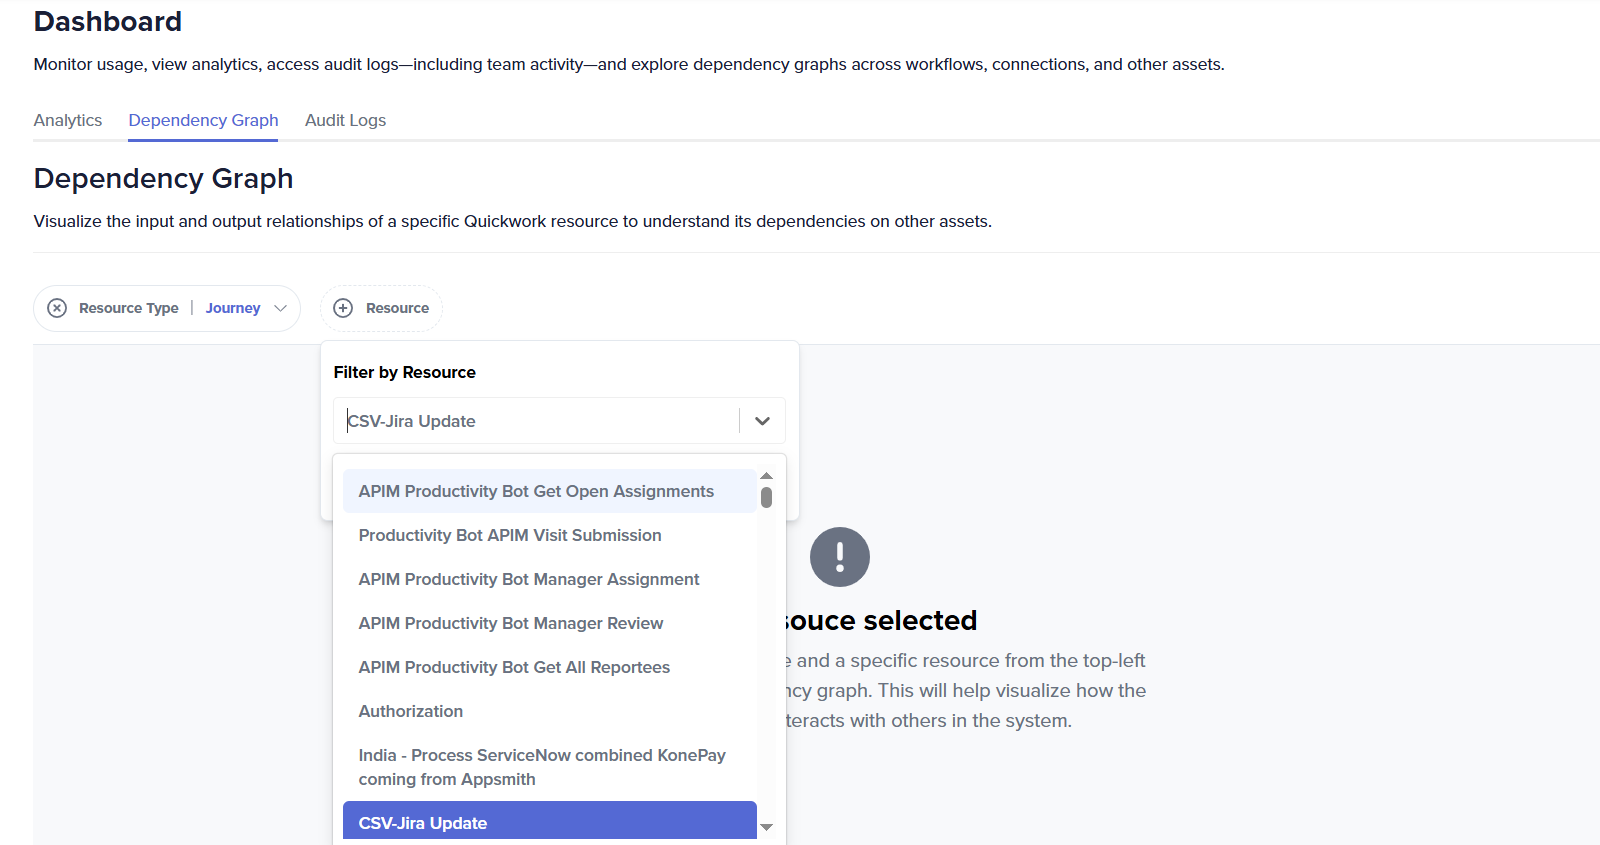
- After selecting a Resource Type, use the Resource drop-down to choose the specific item whose dependencies you want to view.
- This list dynamically populates based on the resource type you have chosen. For example:
- If you selected Journey, it displays all Journeys in your account.
- If you selected Database Table, it lists all database collections.
- If you selected Connection, it shows all app connections configured in your workspace.
Once a resource is selected, the Dependency graph automatically loads and visualizes how the chosen item interacts with other system components, such as connected Journeys, APIs, constants, or databases.
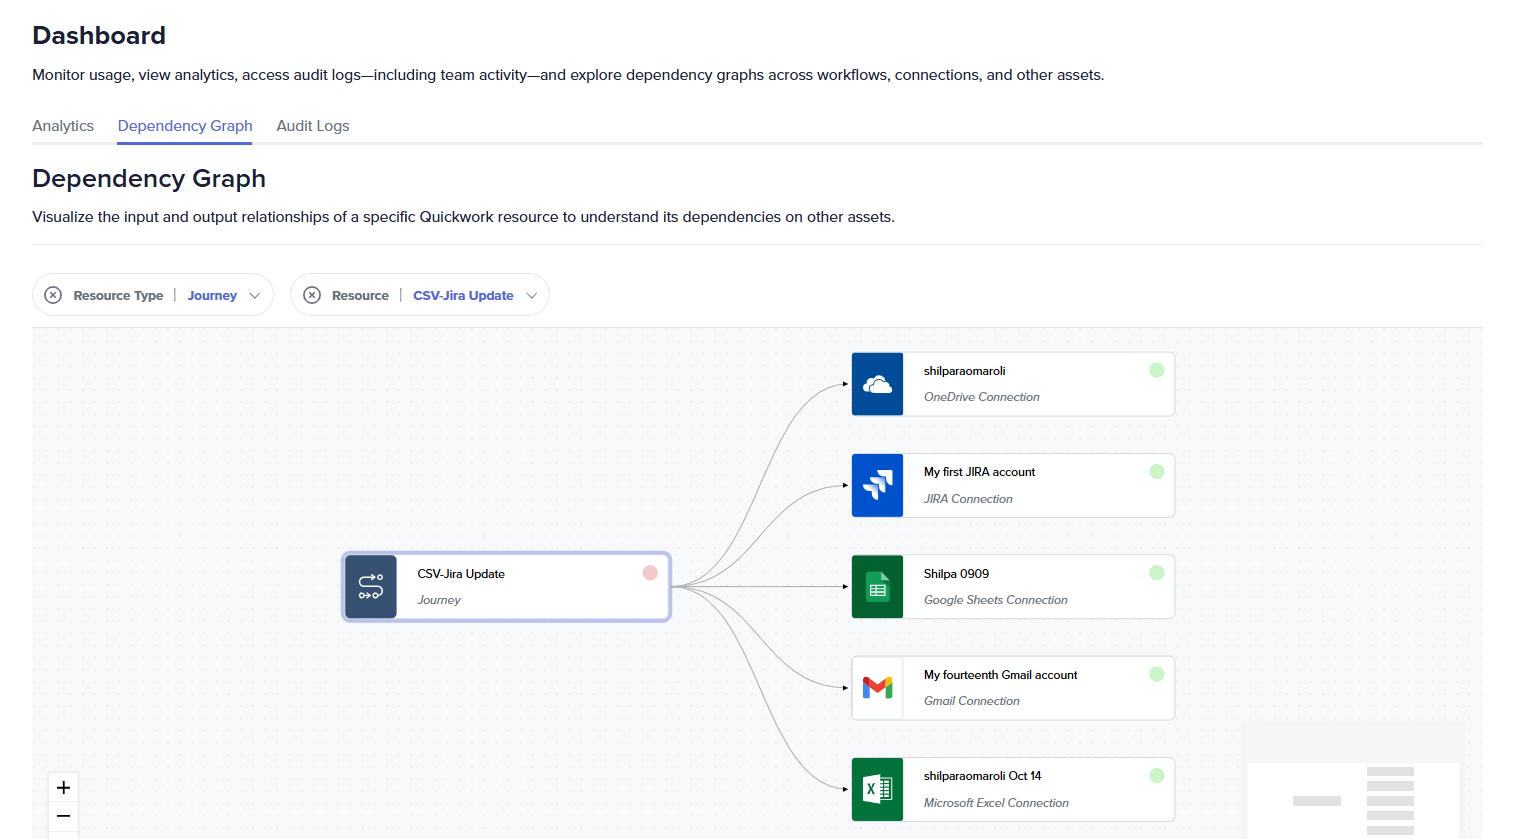
This visualization helps you:
- Identify all assets linked to the selected resource.
- Understand upstream and downstream dependencies.
- Optimize and troubleshoot interconnected Journeys.
While the Dependencies tab in a Journey displays dependencies at the individual Journey level, the Dependency Graph page provides a holistic view of dependencies across the entire workspace, based on the selected resource type and specific resource.