Monitoring
This section provides real-time API performance metrics-including request count, status codes, and response times, for journeys configured in API Management.
The Monitoring tab becomes active only when the Journey is selected in API Management while creating an API endpoint. This means the metrics shown, such as request count, status code breakdown, and response time-are collected only if the Journey is exposed via the API Gateway as part of an API endpoint.
This ensures that monitoring is tied to actual API usage, allowing you to:
- Track API calls made to the Journey
- Identify trends and anomalies in request-response behavior
- Optimize API performance based on real-time data
The Monitoring tab is available only for Journeys that are published as Callable Journeys and managed through the API Management tool. It does not appear for standard event-based Journeys that do not expose an API endpoint.
Key monitoring metrics displayed
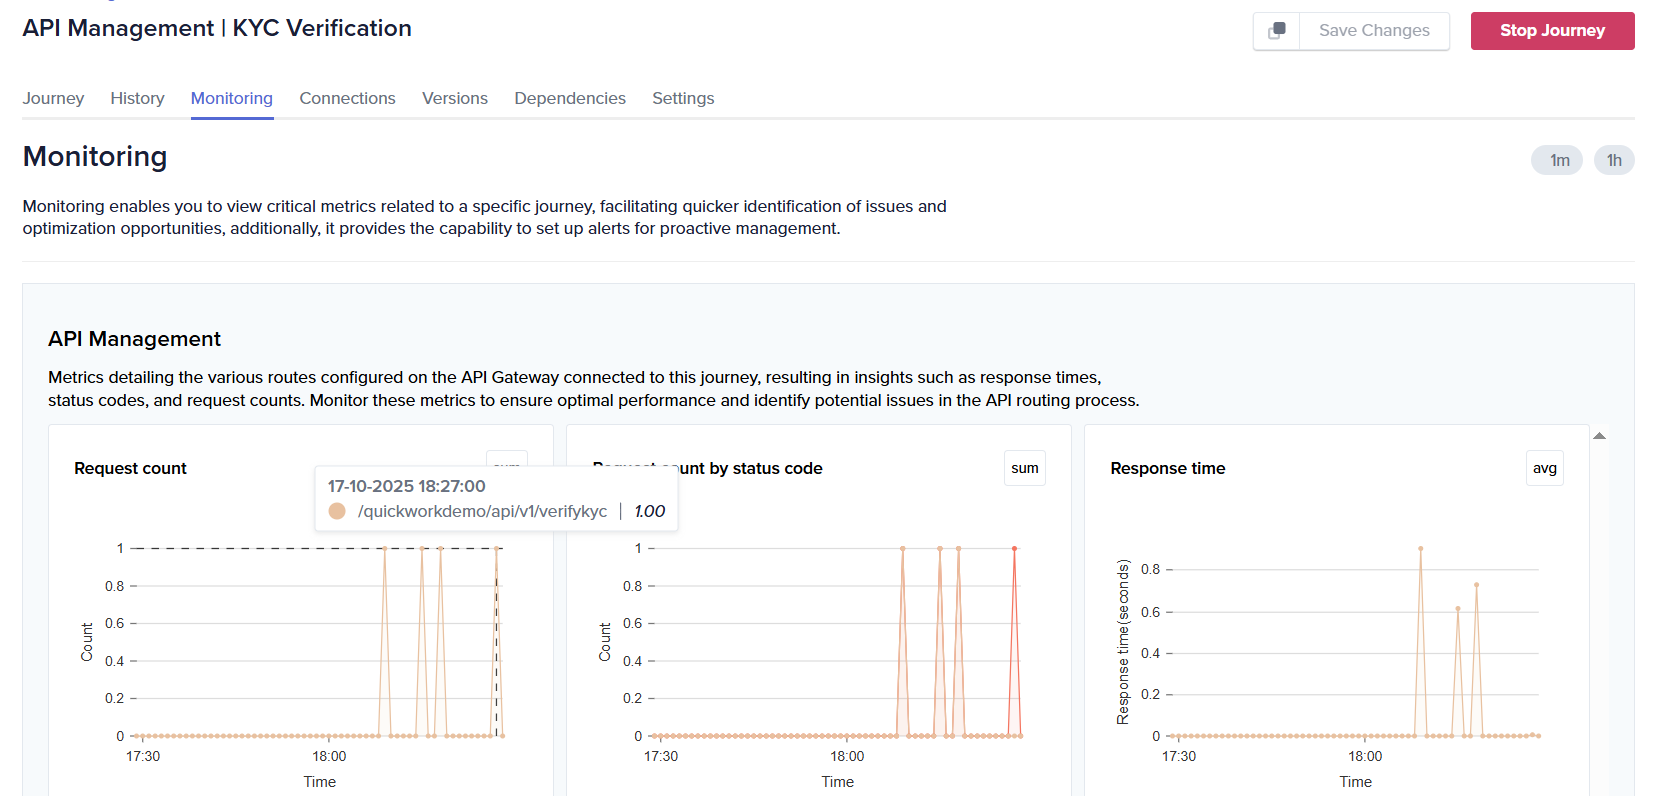
Request count
- Shows the total number of requests made to this Journey over time.
- Helpful in understanding the traffic load or usage frequency.
- In this example, a request was made to the /quickworkdemo/api/v1/verifykyc endpoint at 18:27 PM. By moving the pointer over the Request count graph, a tooltip appears showing detailed metrics such as the timestamp, endpoint name, and request count (1.00). This confirms that the API gateway successfully received and processed the request.
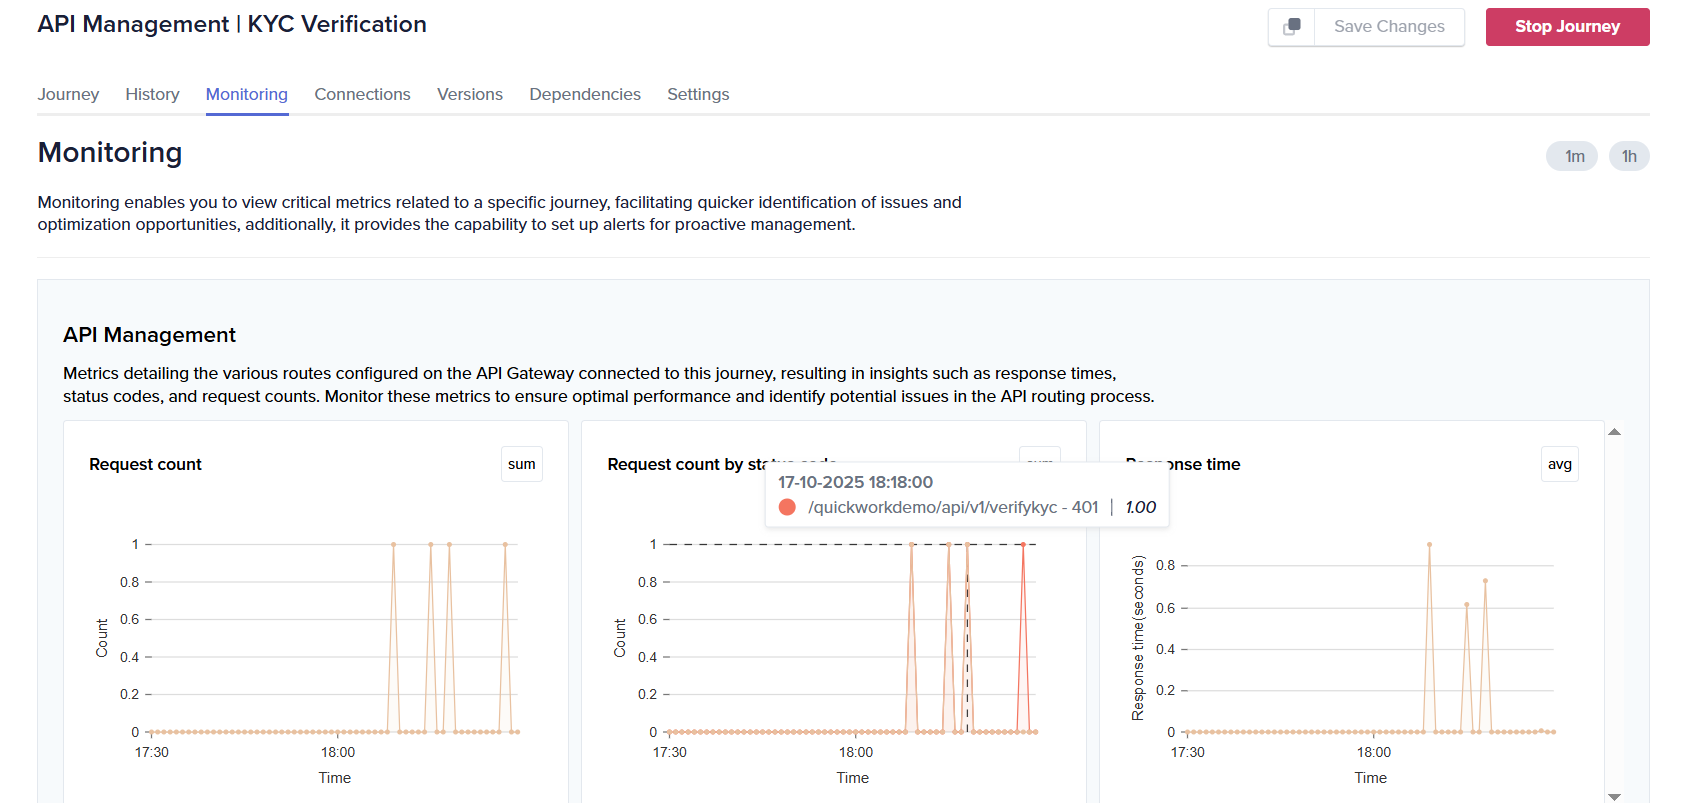
Request count by status code
-
Breaks down requests by their HTTP response status codes (For example, 200, 400, 500).
-
Useful for spotting trends in failed or successful API calls.
-
By hovering over the Request count by status code graph, the tooltip reveals detailed metrics including the timestamp, endpoint name, and status code. In this example, the API call to /quickworkdemo/api/v1/verifykyc at 18:27 PM returned a 401 status code, indicating an authentication or authorization failure.
The Request Count and Request Count by Status Code graphs show that the request was successfully received by the API gateway, but the credentials or access token used were invalid or missing. Meanwhile, the Response time graph shows that the request was processed quickly before returning the 401 response.
Response time
- Displays the average response time (in seconds) for the Journey.
- Helps identify performance bottlenecks or latency issues.
- The Response time graph, as shown in both examples above, indicates that the request was processed quickly before returning either a 200 (success) or 401 (authentication failure) response.
Purpose
These metrics are vital for:
- Troubleshooting issues in Journey execution.
- Detecting spikes in error rates or request load.
- Supporting operational monitoring and alerting.
❓ Troubleshooting
-
No data appearing in Monitoring tab:
- Ensure that the Journey is started; inactive Journeys do not log API metrics.
- If the endpoint was called recently, wait a few minutes and refresh, the dashboard updates periodically.